Wednesday, December 3rd, 2025
Daily Technical Analysis
Market Report
Market Summary
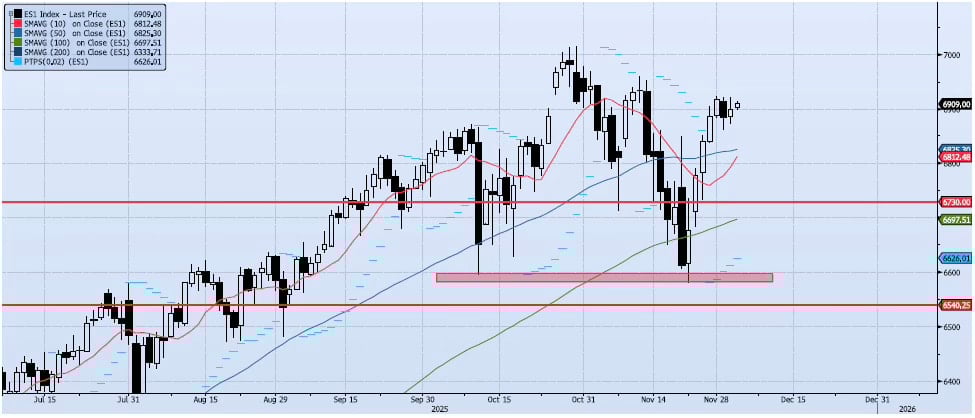
The ES1 Index (Generic 1st Month S&P 500 E-mini) gained 20bps on the session, closing just below 6900 at 6898. The index pushed up to the 6920 level, hitting a high of 6921. This is the third consecutive test of ~6920 in as many sessions, establishing it as trade resistance for the near-term. I believe this level is worth paying attention to. Momentum and trend continue to hold/expand slightly. Both my Spot VIX and VIX Term Structure signals remain “risk on”. I continue to see two main themes as we head into the end of the year; unusually high price volatility and risk skewed to the upside.📈
Support Levels
- 6825: 50dma
- 6730: Previous Support/Resistance
- 6697: 100dma
- 6540: Oct 10 Low (Crucial Support)
📉
Resistance Levels
- 6900: Nov 12 High
- 7050: Measure Move from Consolidation
Technical Chart
Risk Disclaimer: Past performance is not indicative of future results. Trading and investing in commodity interests involves substantial risk of loss. All trading decisions should be made in consultation with a qualified financial advisor.