Tuesday, January 6th, 2026
Daily Technical Analysis
Market Report
Market Summary
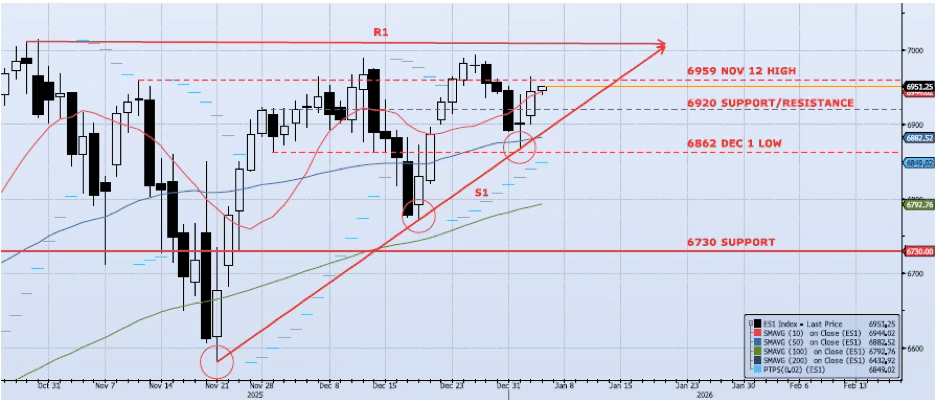
The ES1 Index (Generic 1st Month S&P 500 E-mini) gained 63bps during yesterday’s session, closing at 6943. The index tested resistance at 6959 with a high of 6963 and managed to close above the 6920 level and the 10dma (ref 6937. My VIX signals are neutral/risk on. I would note that S1 support (see chart) was not even tested as the index remained within the ascending triangle and climbing. As I wrote yesterday, “I would remain long the index above 6875 and add on a breakout above 7000. However, if the index were to break down below S1, the potential for a significant move lower would become very real. At that point I would look for a move down to 6730 or 6540.” I have not changed my view.📈
Support Levels
- 6920: Near-Term Resistance (Nov 28 – Dec 4)
- 6862: Dec 1 Low
- 6882: 50dma
- 6730: Previous Support/Resistance
- 6792: 100dma
- 6540: Oct 10 Low (Crucial Support)
📉
Resistance Levels
- 6959: Nov 12 High
- 7013: All-Time High (Oct 30)
Technical Chart
Risk Disclaimer: Past performance is not indicative of future results. Trading and investing in commodity interests involves substantial risk of loss. All trading decisions should be made in consultation with a qualified financial advisor.