Tuesday, December 9th, 2025
Daily Technical Analysis
Market Report
Market Summary
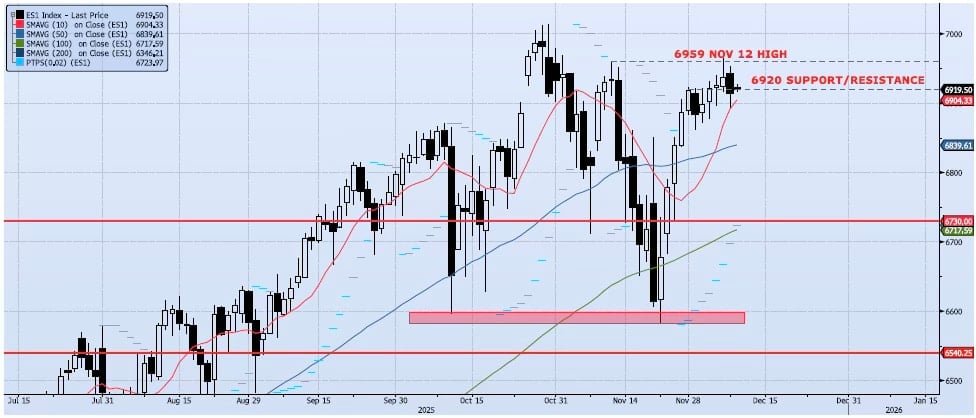
The ES1 Index (Generic 1st Month S&P 500 E-mini) lost 34bps yesterday, closing at 6913. On the session, the index faded our 6959-resistance level (Nov 12 and Dec 5 highs), broke and closed below our previously highlighted near-term support level at 6920 and tested the 10dma (ref 6890) with a low of 6893. Momentum and trend indicators faded. Both my Spot VIX and VIX Term Structure signals remain “risk on”. I continue to see two main themes as we head into the end of the year; unusually high price volatility and risk skewed to the upside. I would remain focused on price action around the 6959 and 6920 levels. In my opinion, the index needs a quick, hard move back above the 6959 level. I believe this is the more likely outcome for the coming days. The 6920 level needs to be re-taken and held.📈
Support Levels
- 6920: Near-Term Resistance (Nov 28 – Dec 4)
- 6836: 50dma
- 6730: Previous Support/Resistance
- 6712: 100dma
- 6540: Oct 10 Low (Crucial Support)
📉
Resistance Levels
- 6959: Nov 12 High
- 7050: Measure Move from Consolidation
Technical Chart
Risk Disclaimer: Past performance is not indicative of future results. Trading and investing in commodity interests involves substantial risk of loss. All trading decisions should be made in consultation with a qualified financial advisor.