Tuesday, December 16th, 2025
Daily Technical Analysis
Market Report
Market Summary
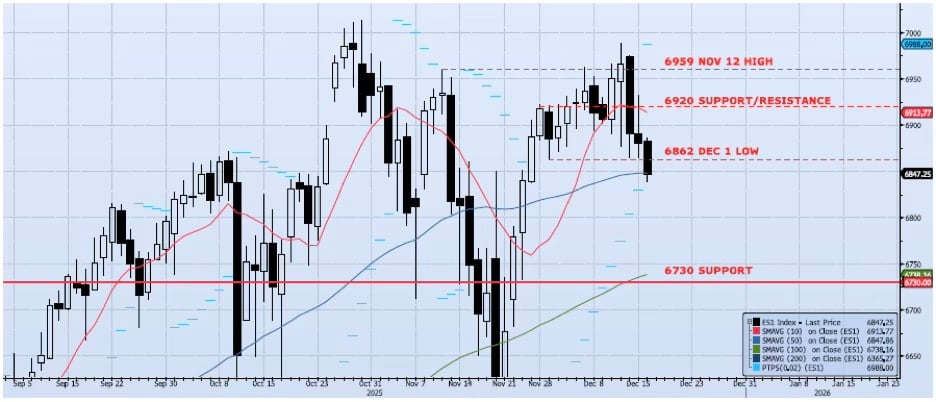
The ES1 Index (Generic 1st Month S&P 500 E-mini) lost 14bps yesterday, closing at 6881. Price action was negative. The early session high (ref 6932) faded hard heading into the cash close, testing and holding support at 6862 with a low of 6864. The 6862 level has been a focus for the past two weeks; it is key and must hold. Momentum and trend indicators broke down, confirming price weakness. That all said, both my Spot VIX and VIX Term Structure signals remain “risk on”. I have continued to believe and write that there will be two main themes as we head into the end of the year; unusually high price volatility and risk skewed to the upside. I will maintain that view unless the 6862 level breaks. If we see this level break on an intra-day and closing basis I would expect the index to test 6730 in very short order.📈
Support Levels
- 6920: Near-Term Resistance (Nov 28 – Dec 4) (BROKEN)
- 6862: Dec 1 Low (TESTED)
- 6847: 50dma
- 6730: Previous Support/Resistance
- 6738: 100dma
- 6540: Oct 10 Low (Crucial Support)
📉
Resistance Levels
- 6959: Nov 12 High
- 7050: Measure Move from Consolidation
Technical Chart
Risk Disclaimer: Past performance is not indicative of future results. Trading and investing in commodity interests involves substantial risk of loss. All trading decisions should be made in consultation with a qualified financial advisor.