Thursday, December 4th, 2025
Daily Technical Analysis
Market Report
Market Summary
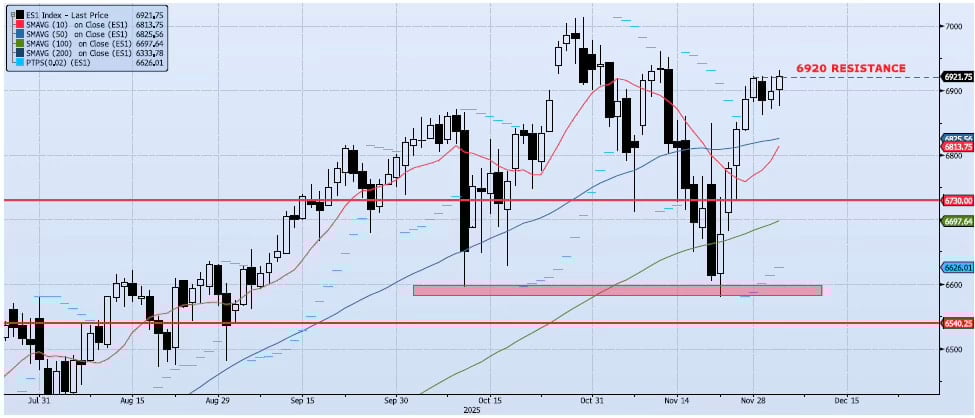
The ES1 Index (Generic 1st Month S&P 500 E-mini) gained 35bps during yesterday’s session, hitting an intra-day high of 6931 and closing at 6922. I continue to see 6920 as a pivot point for the index with the last four sessions rallying up to or dancing around this level. It is clearly trade resistance for the near-term. Both my Spot VIX and VIX Term Structure signals remain “risk on”. I continue to see two main themes as we head into the end of the year; unusually high price volatility and risk skewed to the upside. On a broader note, I am starting to see signs of weakness on my intermediate and long-term counts. While the index could easily push higher in the short-term, we need these longer-term signals to improve significantly to reduce the risk of a shift to a High Vol-Bear regime in 2026. The 6540 level will be crucial over the coming months.📈
Support Levels
- 6825: 50dma
- 6730: Previous Support/Resistance
- 6697: 100dma
- 6540: Oct 10 Low (Crucial Support)
📉
Resistance Levels
- 6900: Nov 12 High
- 7050: Measure Move from Consolidation
Technical Chart
Risk Disclaimer: Past performance is not indicative of future results. Trading and investing in commodity interests involves substantial risk of loss. All trading decisions should be made in consultation with a qualified financial advisor.