Thursday, December 18th, 2025
Daily Technical Analysis
Market Report
Market Summary
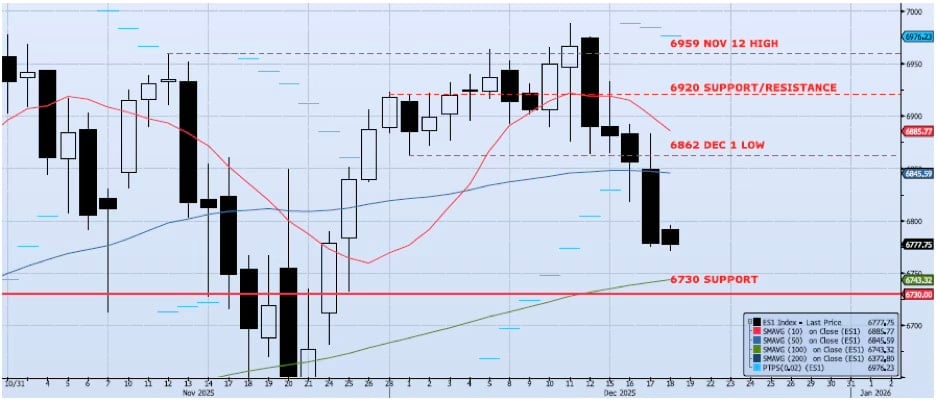
The ES1 Index (Generic 1st Month S&P 500 E-mini) lost 1.13% during yesterday’s session, closing near the low at 6778. Momentum and trend indicators continued to degrade as the 6862 and 50dma (ref 6847) support levels broke. My Spot VIX and VIX Term Structure signals remain “risk on”. I have continued to write that although price volatility is abnormally high, risk is skewed to the upside. That said, I also wrote that, “I will maintain that view unless the 6862 level breaks. If we see this level break on an intra-day and closing basis, I expect the index to test 6730 in very short order.” The index hit an early session high of 6882, then failed, slicing through our 6862-support level and continuing to slide to a session low of 6775. I expect to see the index test 6730 in the coming days.📈
Support Levels
- 6920: Near-Term Resistance (Nov 28 – Dec 4) (BROKEN)
- 6862: Dec 1 Low (BROKEN)
- 6847: 50dma (BROKEN)
- 6730: Previous Support/Resistance
- 6743: 100dma
- 6540: Oct 10 Low (Crucial Support)
📉
Resistance Levels
- 6959: Nov 12 High
- 7050: Measure Move from Consolidation
Technical Chart
Risk Disclaimer: Past performance is not indicative of future results. Trading and investing in commodity interests involves substantial risk of loss. All trading decisions should be made in consultation with a qualified financial advisor.