Monday, November 24th, 2025
Daily Technical Analysis
Market Report
Market Summary
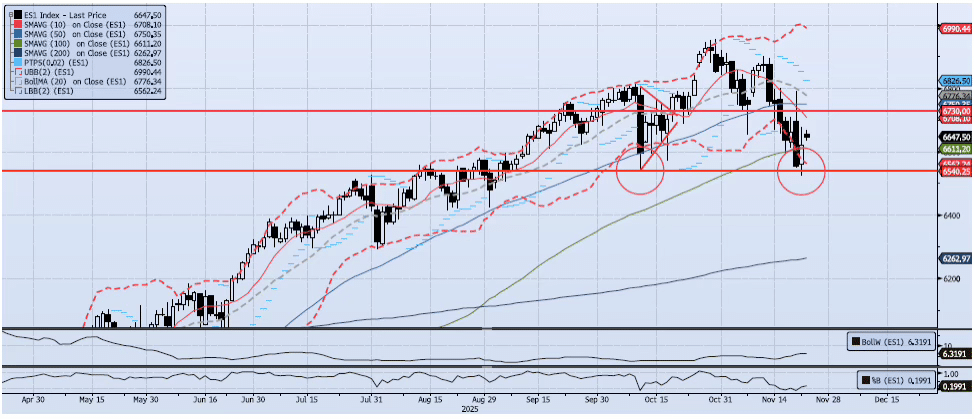
The ES1 Index (Generic 1st Month S&P 500 E-mini) gained 96bps during Friday’s session, closing at 6620. The index hit an overnight low of 6525, just below our focal support level at 6540. The index held and rallied into and throughout the cash session, hitting a high of 6677 then fading slightly into the close. Price action was volatile on the day, as the index had a range of over 150 points, or 2%. Momentum and trend paused the recent breakdown. My Spot VIX signal shifted to “risk on” (this is important). My VIX Term Structure signal shifted back to “neutral”. Overall, the index showed some positive action as it held our 6540-support level (double bottom highlighted on chart) and closed back above the 100dma (ref 6608). As I mentioned on Nove 19, 20 and 21, “I would reduce any remaining short exposure at current levels (ref 6582) and begin to focus squarely on the 6540 level for the next few sessions.” That approach has worked, my bias would be to remain flat here, waiting for the next few sessions to wash out. On a broader note, I am starting to see signs of weakness on my intermediate and long-term counts. While the index could easily push higher in the short-term, we need these longer-term signals to improve significantly in order to reduce the risk of a shift to a High Vol-Bear regime in 2026.📈
Support Levels
- 6608: 100dma
- 6540: Oct 10 low
📉
Resistance Levels
- 6750: 50dma
- 6789: 20dma
- 6900: Nov 12 High
- 7050: Measure Move from Consolidation
Technical Chart
Risk Disclaimer: Past performance is not indicative of future results. Trading and investing in commodity interests involves substantial risk of loss. All trading decisions should be made in consultation with a qualified financial advisor.