Monday, May 5th, 2025

Current ICAP Momentum/Trend Model Signal: POSITIVE (Day Count = 8)
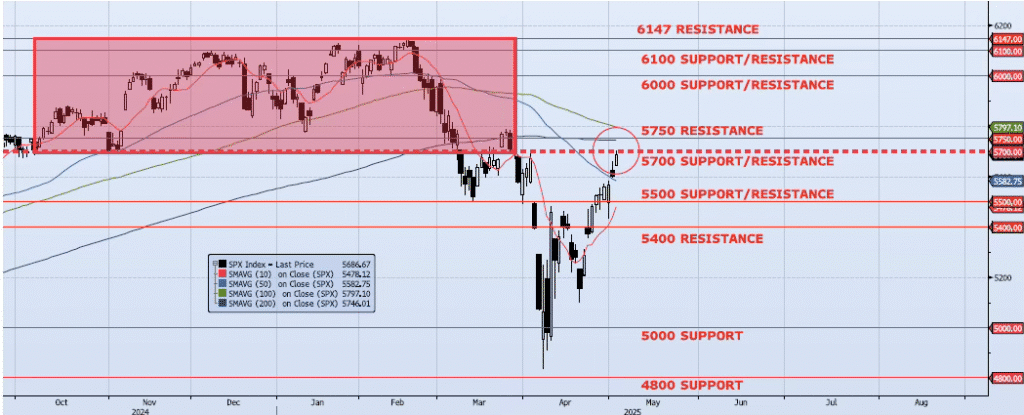
The SPX index gained 1.47% on Friday, closing at 5686. As I wrote back on Apr 25, “All said, if internals can hold and the MOTR signal remains Positive, I could see this rally potentially testing 5700.” That was indeed the case as the index hit a high on Friday of 5700.70. Momentum and trend indicators remain positive but are slowing. The 5700 level represents the base of the topping formation which I identified back in January. This level should act as significant resistance and could potentially be an intermediate term high for the index. While the index could potentially break back above 5700, I think the greater probability trade is a reversal and fade back towards the 5000 level. I continue to see the greater risk as skewed to the downside.
Trade Support:
5000: ~20% Move Peak-to-Trough
4800: Dec 2021/Jan 2022 High
4200: ~50% Retracement Mar 2020 Low to Feb 2025 High
3700: ~Nov 2022 Low and 61.8% Retracement Mar 2020 Low to Feb 2025 High
Trade Resistance:
5400: Sep 2024 Lows and Apr 3 Low/Close (BROKEN)
5500: ~10% Move Peak-to-Trough (BROKEN)
5582: 50dma (BROKEN)
5700: Previous Support Sep/Nov (TESTED)
5750: 38.2% Retracement Peak-to-Trough
6000: Previous Support