Monday, January 5th, 2026
Daily Technical Analysis
Market Report
Market Summary
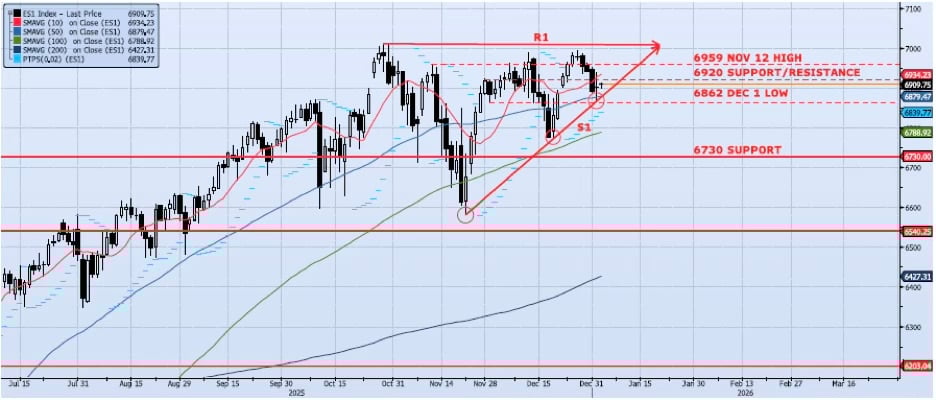
The ES1 Index (Generic 1st Month S&P 500 E-mini) gained 12bps during Friday’s session, closing at 6900. The stick was a massive display of indecision with a high/low spread of 73 handles and an open/close spread of just 2. The result was a candlestick with a nonexistent body and two massive tails (bullish on balance). What I think is of major importance is that the index held support on an intermediate term uptrend line (S1), held our previously highlighted support at 6862 and closed just above 6900. Note as well that S1 is the support line in what I think could be a bullish ascending triangle. My VIX signals are neutral/risk on. If the index can breakout above the top of this suspected ascending triangle, the set up would be for a move to 7400. I would remain long the index above 6875 and add on a breakout above 7000. However, if the index were to break down below S1, the potential for a significant move lower would become very real. At that point I would look for a move down to 6730 or 6540.📈
Support Levels
- 6862: Dec 1 Low
- 6879: 50dma
- 6730: Previous Support/Resistance
- 6788: 100dma
- 6540: Oct 10 Low (Crucial Support)
📉
Resistance Levels
- 6920: Near-Term Resistance (Nov 28 – Dec 4)
- 6959: Nov 12 High
- 7013: All-Time High (Oct 30)
Technical Chart
Risk Disclaimer: Past performance is not indicative of future results. Trading and investing in commodity interests involves substantial risk of loss. All trading decisions should be made in consultation with a qualified financial advisor.