Monday, February 2nd, 2026
Daily Technical Analysis
Market Report
Market Summary
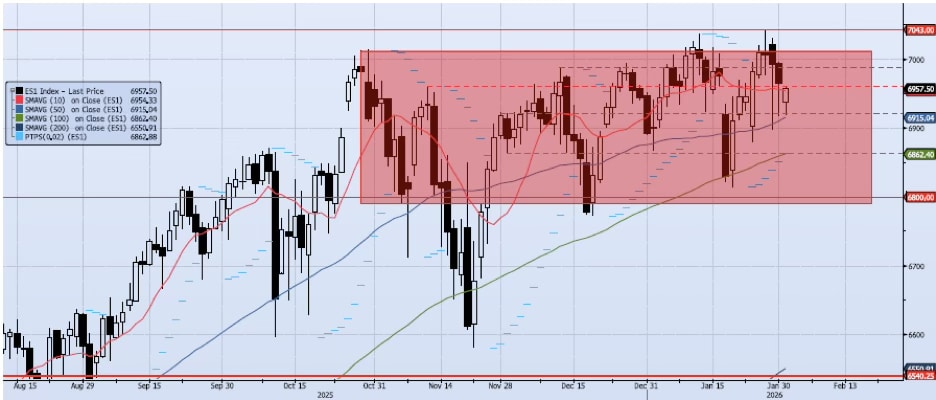
The ES1 Index (Generic 1st Month S&P 500 E-mini) lost 39bps during Friday’s session, closing at 6965. This tick marked a +1.06% month for the index, down from a monthly high return of 2.18% achieved on Jan 28. The index remains extremely volatile with the high/low range for the last four days of the month at 7043/6898. The previously identified 6920 level has continued to be tested (bending but not breaking), leaving the index stuck between support/resistance at 6920/6988. I would remain focused on this range as momentum and trend are showing real degradation on the short-term, intermediate-term, and long-term counts. All in all, I see some potential for a small bounce back to the 7000 level, but overall, I see risk as skewed to the downside with an initial target of 6860 and a secondary target of 6800.📈
Support Levels
- 6920: Near-Term Resistance (Nov 28 – Dec 4)
- 6915: 50dma
📉
Resistance Levels
- 6959: Nov 12 High
- 6988: Dec 12 High
- 7036: All-Time High (Jan 13)
- 7200: Measure Move
Technical Chart
Risk Disclaimer: Past performance is not indicative of future results. Trading and investing in commodity interests involves substantial risk of loss. All trading decisions should be made in consultation with a qualified financial advisor.