Monday, December 8th, 2025
Daily Technical Analysis
Market Report
Market Summary
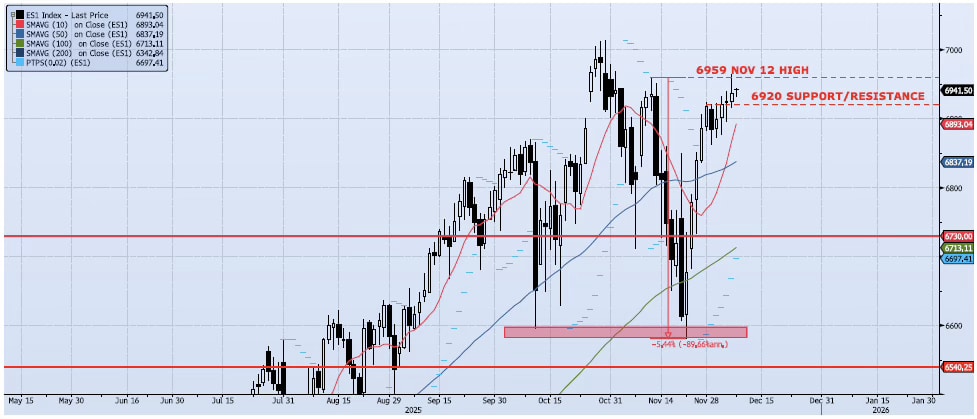
The ES1 Index (Generic 1st Month S&P 500 E-mini) gained 17bps during Friday’s session, closing at 6937. This closing tick came well below the session high (ref 6963) and well above the previously identified 6920 resistance level. I would note that the index high was within four handles of the Nov 12 high of 6959 (see chart). This Nov 12 high marked the pivot point for the subsequent -5.44% move down to the Nov 21 low (ref 6580). As the index grinds higher, momentum and trend indicators remain generally constructive. Both my Spot VIX and VIX Term Structure signals remain “risk on”. I continue to see two main themes as we head into the end of the year; unusually high price volatility and risk skewed to the upside. I would remain focused on price action around the 6959 and 6920 levels.📈
Support Levels
- 6920: Near-Term Resistance (Nov 28 – Dec 4)
- 6837: 50dma
- 6730: Previous Support/Resistance
- 6713: 100dma
- 6540: Oct 10 Low (Crucial Support)
📉
Resistance Levels
- 6959: Nov 12 High
- 7050: Measure Move from Consolidation
Technical Chart
Risk Disclaimer: Past performance is not indicative of future results. Trading and investing in commodity interests involves substantial risk of loss. All trading decisions should be made in consultation with a qualified financial advisor.