Monday, December 22nd, 2025
Daily Technical Analysis
Market Report
Market Summary
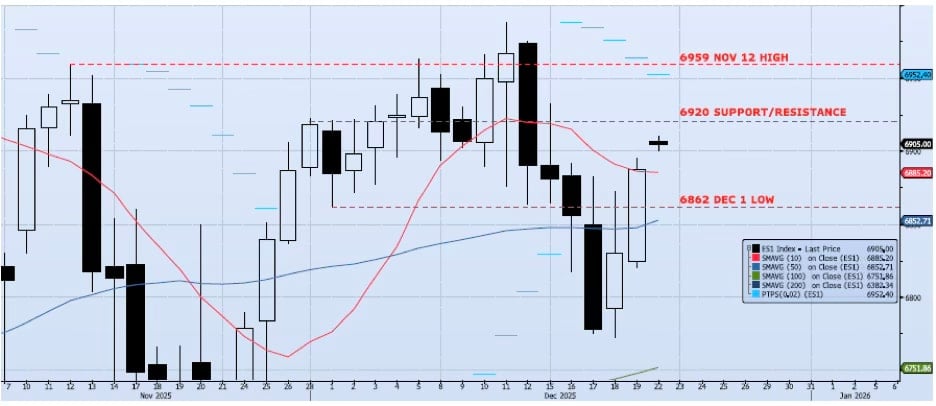
The ES1 Index (Generic 1st Month S&P 500 E-mini) gained 83bps during Friday’s session, closing at 6887, well off the 6820 low. Momentum and trend indicators improved with price. My Spot VIX and VIX Term Structure signals remain “risk on”. I wrote on Friday morning that, “Although I have been writing about and expecting increased price volatility into year end, the price action over the past few days has been confusing. I see the current set up as presenting a binary trade, long above 6862 and short below. I believe this level is significant enough to act as a trade pivot point.” The index spiked back above the 6862 level at ~10:00 AM ET and is currently ticking at 6904 in the overnight session. All said, this approach has worked. I would remain focused on the current support/resistance range of 6862/6920.📈
Support Levels
- 6920: Near-Term Resistance (Nov 28 – Dec 4) (BROKEN)
- 6862: Dec 1 Low
- 6852: 50dma
- 6730: Previous Support/Resistance
- 6751: 100dma
- 6540: Oct 10 Low (Crucial Support)
📉
Resistance Levels
- 6959: Nov 12 High
- 7050: Measure Move from Consolidation
Technical Chart
Risk Disclaimer: Past performance is not indicative of future results. Trading and investing in commodity interests involves substantial risk of loss. All trading decisions should be made in consultation with a qualified financial advisor.