Monday, December 15th, 2025
Daily Technical Analysis
Market Report
Market Summary
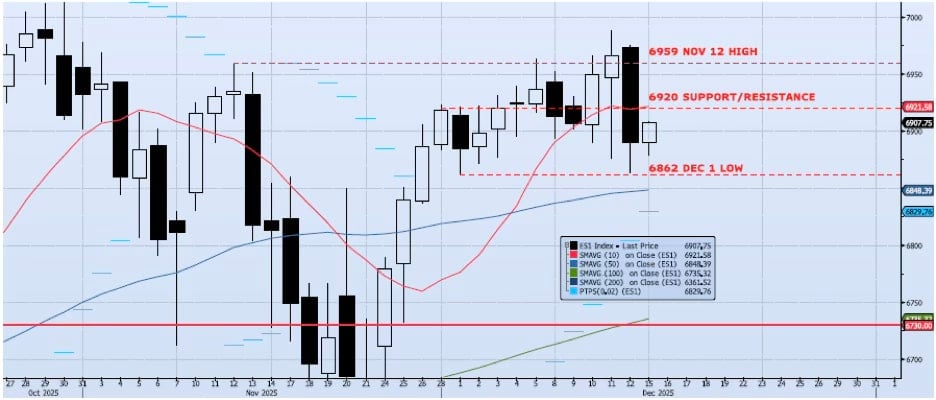
The ES1 Index (Generic 1st Month S&P 500 E-mini) lost 1.09% during Friday’s session, testing the Dec 1 low (ref 6862) with a low of 6864 and a closing print of 6890. Momentum and trend indicators faded with price. Both my Spot VIX and VIX Term Structure signals remain “risk on”. I have continued to believe and write that there will be two main themes as we head into the end of the year; unusually high price volatility and risk skewed to the upside. I have not changed my mind yet.📈
Support Levels
- 6920: Near-Term Resistance (Nov 28 – Dec 4) (BROKEN)
- 6862: Dec 1 Low (TESTED)
- 6848: 50dma
- 6730: Previous Support/Resistance
- 6735: 100dma
- 6540: Oct 10 Low (Crucial Support)
📉
Resistance Levels
- 6959: Nov 12 High
- 7050: Measure Move from Consolidation
Technical Chart
Risk Disclaimer: Past performance is not indicative of future results. Trading and investing in commodity interests involves substantial risk of loss. All trading decisions should be made in consultation with a qualified financial advisor.