Monday, August 4th, 2025

Current ACAP Momentum/Trend Model Signal: NEGATIVE (Day Count = 3)
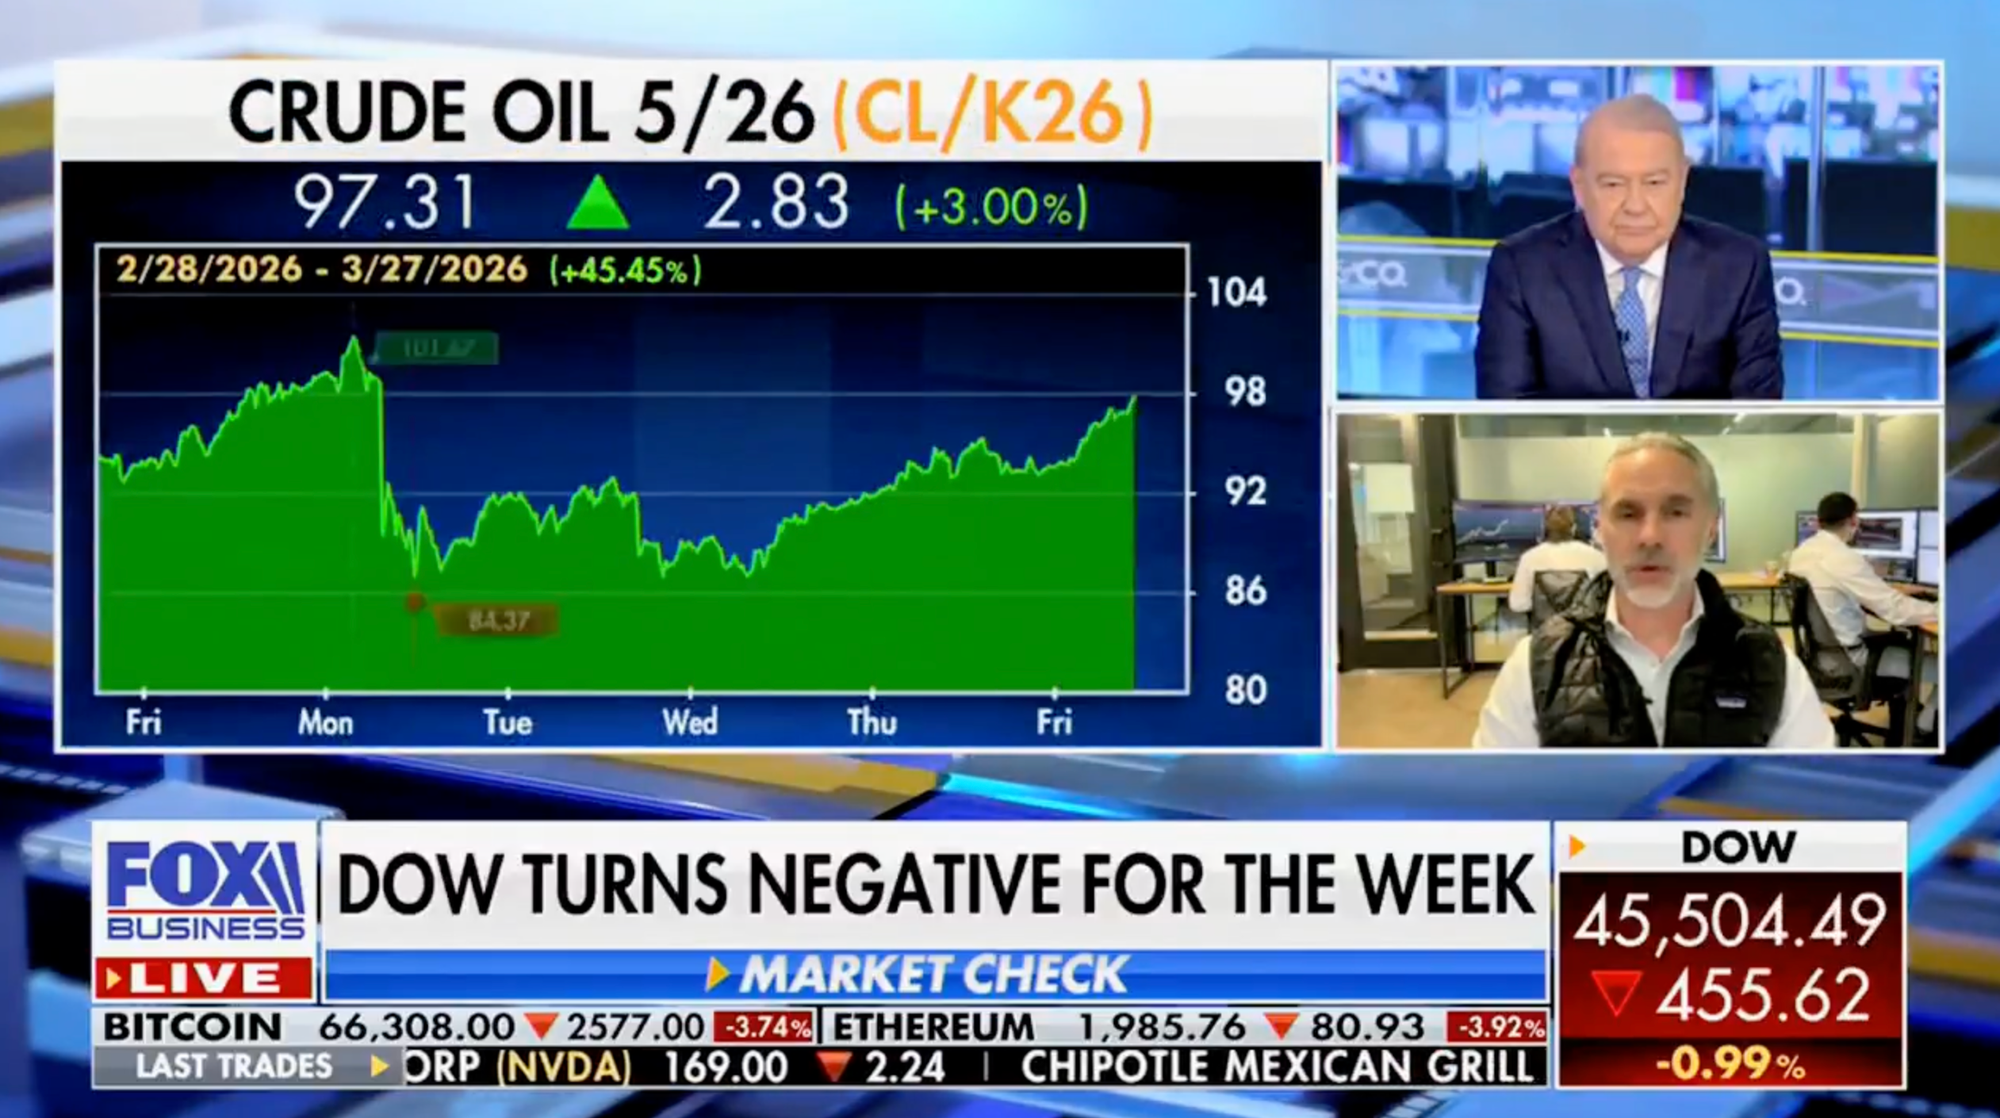
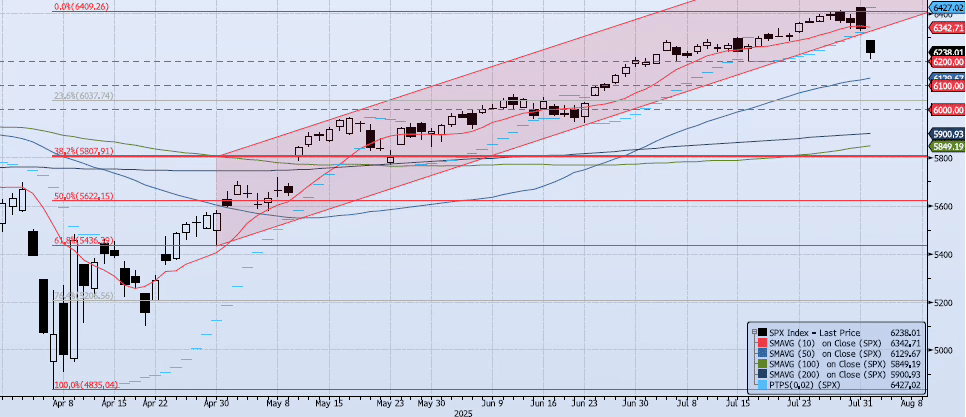
The SPX index lost 1.60% during Friday’s session, closing at 6238. The session created a gap down out of the previously highlighted uptrend channel which originated on April 30 (see chart). The index has now marked a two-day, peak-to-trough move of -3.33%. The low ticked at 6212, essentially testing my first downside support level of 6200. My momentum and trend indicators have continued to degrade. Spot VIX spiked (trough-to-peak) ~50% in just two sessions. The ACAP Momentum/Trend Model signal remains Negative. All said, the ACAP process was ahead of this gap down as the signal shifted to Negative on the July 30 cash close. In fact, on July 30 I wrote that a “significant bearish engulfing patter” had developed. On July 31 I wrote, “There is obvious churn within the model, setting up for a powerful move off current levels. Risk is slightly skewed to the downside as the index’s inability to break out above 6400 remains an issue.” On August 1 I wrote, “Risk remains skewed to the downside as 6400 establishes itself as firm resistance.” At this time risk remains skewed to the downside but I would be focused on reducing short exposure unless 6200 breaks. Model aside, I could easily see the index rally off Friday’s low as the VIX settles back down to the 18 level.
Trade Support:
6200: July 7 Low (TESTED)
6147: Previous All-Time High (Feb 19)
6100: Previous Support
6000: Previous Support
Trade Resistance:
6284: All-Time High (Jul 3)
6390: Fibonacci Projection (Aug ’22 Low to Feb ’24 High)
6400: July 28 All-Time High