Friday, November 21st, 2025
Daily Technical Analysis
Market Intelligence Report
Market Summary
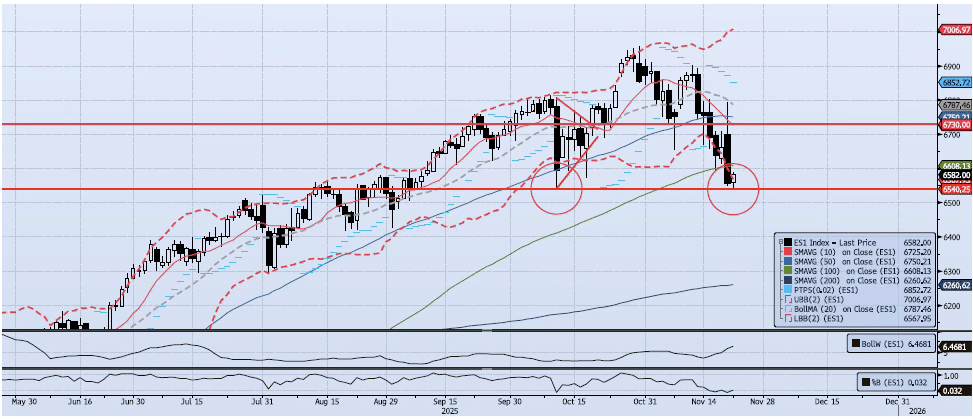
The ES1 Index (Generic 1st Month S&P 500 E-mini) lost 1.56% yesterday, closing near the lows at 6557. Price hit an early session high (ref 6791), testing previously identified resistance at the 20dma (ref 6799) and then faded for a peak-to-trough move of -3.55%. Momentum and trend continue to degrade. My Spot VIX signal shifted to “risk off”. My VIX Term Structure signal remains “risk off”. I have continued to focus on the 6730 level with a short bias below and a long bias above. This approach has worked out very well over the past few weeks. As I wrote on Nov 19, “I would be reducing the short exposure here (ref 6648) and gradually covering the balance of the short as/if the index approaches and trades back above 6730. If the index were to break back below the 100dma I would put those shorts back out and focus on our downside target of 6540.” The index did in fact break down below the previously identified support level at the 100dma (ref 6608) hitting a low currently at (you guessed it) 6539.25. That’s within 1 point of my downside target of 6540. I would reduce any remaining short exposure at current levels (ref 6582) and begin to focus squarely on the 6540 level for the next few sessions.📈
Support Levels
- 6608: 100dma (BROKEN)
- 6540: Oct 10 low
📉
Resistance Levels
- 6750: 50dma
- 6799: 20dma
- 6900: Nov 12 High
- 7050: Measure Move from Consolidation
Technical Chart

Risk Disclaimer: Past performance is not indicative of future results. Trading and investing in commodity interests involves substantial risk of loss. All trading decisions should be made in consultation with a qualified financial advisor.
